Lies, Damn Lies and Insolvency Statistics

TL;DR- Reports on the rise in insolvency numbers are flawed - things aren’t that bad and should actually be worse - and anyway, insolvency numbers are the wrong measure to understand potential business issues in the economy.
BACKGROUND
There have been a large number of articles of late highlighting the recent surge in insolvencies in Australia, what that implies about the economy and how concerned we should all be.
This post seeks to set the record straight on insolvencies and provide insights into better ways to think about business risk than pure insolvency numbers.
ARE INSOLVENCIES GROWING
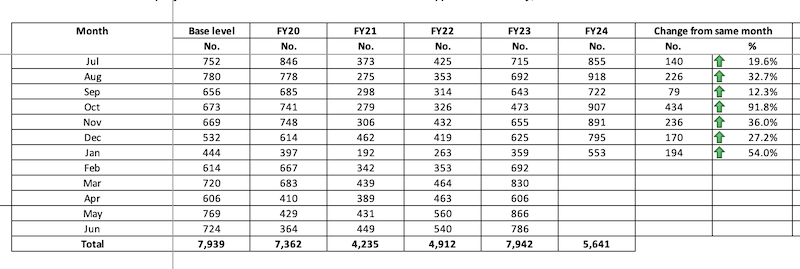
This is a big YES. Insolvencies are definitely growing rapidly compared to last year. Check out these numbers provided by ASIC that most of the recent acticles have been reporting on:

However, raw numbers lack context.
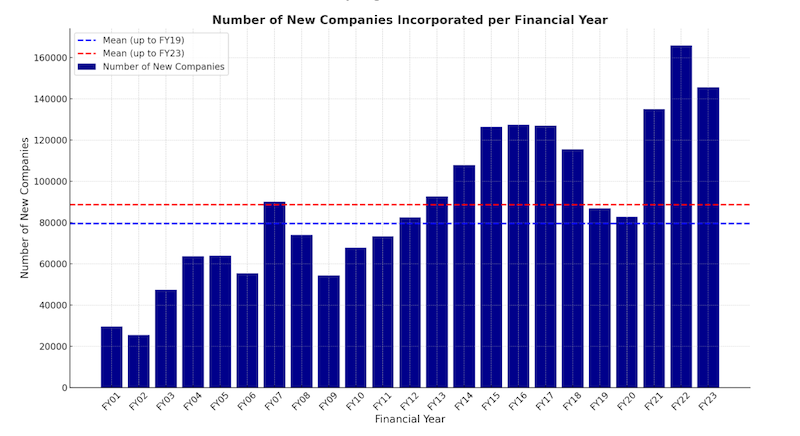
All things being equal you’d expect insolvencies to increase over time because there’s probably a natural attrition rate for companies and the number of companies continues to increase over time. In fact the number of incorporated companies has almost tripled from approximately 1.2M to 3.3M since 2000 according to ASIC's records.
INSOLVENCIES PER COMPANY (I/C) - THE BETTER MEASURE
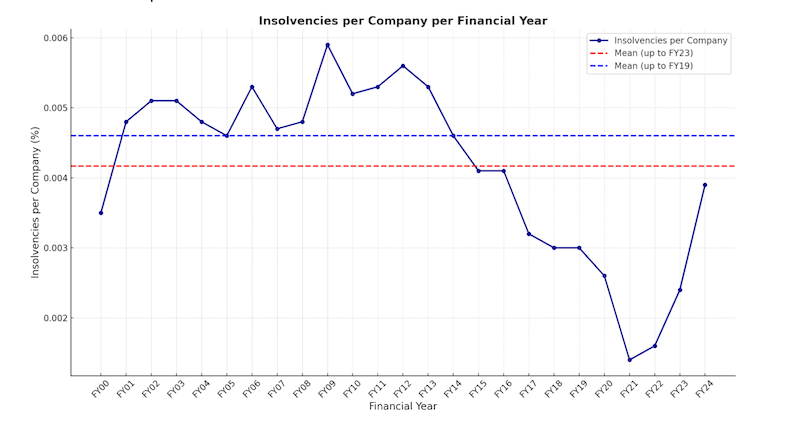
If we take into account the number of actual insolvencies AND the number of registered companies that could potentially become insolvent the numbers paint a very different picture.
The graph below shows that, even if we assume insolvencies will get to 13,000 in FY24, which we’re on track to see and would be ~30% larger than any other recorded year, we’re well below the long-term mean I/C rate and even further below the pre-COVID I/C mean.
In other words, we actually need MORE insolvencies to get back to historical levels of insolvency and insolvencies would need to get to ~20,000 this year to match the previous I/C high of 2009.
NB: The Y axis says % but is the raw number - so 0.004 is actually 0.4%

THE COVID ANOMALY
If you think there’s something odd about insolvencies being at record highs (bummer!) but well below the pre-COVID I/C mean (yay!), you’d be right.
When you look at the data there is something puzzling about new incorporations and total insolvencies during COVID.
Over the past 20 years the highest period of new incorporations was 2020-22. That’s right, during the pandemic that sent shockwaves through the global economy, new incorporations in Australia jumped significantly.

Why? Well, nobody is really sure. Australian Small Business and Family Enterprise Ombudsman, Bruce Billson, suggested COVID made people re-examine their priorities and start their own businesses.
The cynics amongst us might wonder if accessing government incentives during COVID also played a role in this surge as incentives were largely distributed to businesses, not directly to employees.
One thing we do know is that while incorporations increased, insolvencies shrank to all time lows. Known reasons for that reduction include:
- Government Incentives: which kept bad companies alive longer
- Legislative Changes: such as the CERP Legislation which:
- Increased minimum statutory demand amounts from $2000 to $20000
- Increased the allowable response time to demands from 21 days to 6 months
- Allowed directors to trade while insolvent (under certain conditions)
- Lenient lenders: Many offered payment extensions or amendments instead of legal action.
- ATO SME debt collection pause: This provided temporary relief from tax pressure.
SO WHAT DOES THAT ALL MEAN?
In summary, the above means insolvencies are increasing but that’s a good thing as there was a backlog of companies that probably should have ceased operating long ago and we’ve got some way to go before the situation reaches historical insolvency highs.
It’s also worth pointing out that the current situation was predicted by several entities, including Evenly back in 2021.
WHAT'S BEHIND THESE INSOLVENCIES? CASHFLOW ISSUES!
While I/C offers a better picture, the really interesting stuff is why these insolvencies are happening in the first place. Stats from the ATO, COSBOA, Xero and more show it's cash flow issues, mainly due to late payments. Below is a sample of statistics which highlight this issue:
- 90% of business failures are attributed to cash flow problems, often caused by late payments.
- 67% of businesses experience negative impacts from late payments.
- Nearly half of all payments are received late.
- Over $1.1 billion in late payments are owed to small businesses annually.
Late payments create a constant burden for small businesses, hindering growth, job creation, and ultimately, leading to some business failures.
I could go on but the stats are clear. Poor customer payment behaviour creates ongoing stress in SMEs, which make up 99% of businesses in Australia, affecting growth in revenue and employment and on the opposite side leading to business failure.
While ideally we’d be able to closely monitor payment behaviour (we actually do this through our Xero app, PayPredict) across all businesses, there are other leading indicators of worsening payment behaviour which should also be monitored both in businesses and across industries and geographies.
Some of this information is available from traditional bureaus but we think it’s so important it should be freely available in some form to everyone, for no cost, and we're doing something about it.
In the next few weeks we'll be releasing a free tool to to help track payment behaviour and identify potential cash flow risks. Fill in your details here if that's something you want to be notified about.
← Back
If you issue invoices you need PayPredict.
The easy to use Xero app that let's you really know if your customers will pay on time.
Try PayPredict for free